 As you all know, if you are a regular reader of this blog, I have been investing on the Isepankur p2p lending service for over a year. So far, I’m doing pretty well – Isepankur consistently ranks me into the top 10% of investors by achieved ROI. But I have to admit that my strategy was just based on common sense (or call it gut feeling), some general p2p lending knowledge and experience won over time. Of course I obeyed fundamentals like diversification.
Now Isepankur is one of the first European p2p lending marketplaces that made available the raw loan data for everyone. You can download it here.
What does the data export contain?
The data export contains over 50 parameters for each loan that Isepankur orginated since February 2011. Isepankur says new datasets will be published monthly.
How do I analyse the data?
A sophisticated person – or a statistican – will rightly recommend to use multivariate statistics to most accurately get conclusions from analysing this loan data. I don’t have the tools or the expertise to do that, so I thought I just give it a try and look how far I get in Excel. By the way – this is going to be a rather long blog post, but I think you’ll find it worthwhile.
First I defined a population of loans (universe) I wanted to look at. I selected Estonian credit grade “1000” loans (thereby excluding other credit grades and Spanish and Finnish loans) to get a somewhat homogeneous loan population. Initially I looked at loans with the parameter ‘TwoMonthsFromFirstPayment’, in order to look only at loans that are old enough to default. Later I also excluded loans that originated after Sep. 1st, 2013.
That leaves me with a population of 1325 loans to analyse.
What I want to find out
I am trying to find factors in the loan application that indicate an above average probability that a loan will go into 60+ days overdue. While Isepankur actually still recovers large parts of the principal of loans that go into 60+ days overdue (see these useful charts), it would still be great if I as an investor could reduce the percentage of my investments that become 60+ days late. There is a parameter in the download named ‘InDebt60Day’. This is what I analysed. Note that the description says ‘This loan has at one moment been overdue for 60 days’, meaning it does include loans that are now current again, or even paid off. But if we want to reduce the risks of a loan ever going into 60+ days overdue this is the parameter we want to look at.
For 126 of the 1325 loans this parameter is set to ‘1’, meaning the average risk is 9.5%. What does that absolute number tell us? Nothing much yet, it is just a reference point I’ll use to show above average and below average risk loans.
Let’s start
Okay, I downloaded the data set into Excel and excluded all loans other than the population described above. Now I use the pivot table function of Excel to look at the data.
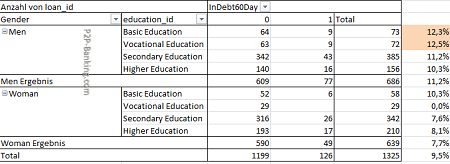
One easy finding is that gender influences the 60+ days risk (from now on I’ll just call it risk in short).

I marked the percentage for loans to men that has ‘InDebt60Day’=’1’ orange as it is considerably above average and the percentage for loans to woman green as it is considerably below average.
Let’s see if it if possible to refine this further to pinpoint an additional risk factor, if I add education.

Not surprisingly the highest risk are men with a low level of education.
Next I looked at the age of the borrowers and found that very young borrowers (18-24 years) represent a risk that is almost double the average. Best risks in the data set are woman borrowers around the age of 25 to 42. That young borrowers pose a higher risk is in line with other services (e.g. Zopa) and general lending. The Isepankur CEO in a forum post acknowledged the increased risk young borrower represent but stated the main cause is not the age itself, but the lower income of these young borrowers.
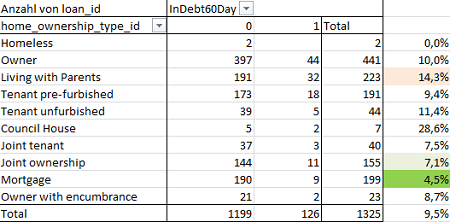
Examining the home ownership type parameter proves most useful. Loans with the value ‘Mortgage’ have a much lower percentage than average. The increased value for ‘Living with Parents’ is not that interesting as it very likely correlates with age (see above). Some of the other percentages are not meaningful, as the sample numbers are too small.

Analysing marital status id yields a surprise. The risk is much lower than average for ‘divorced’. And highest for ‘single’. But both likely correlate with the age parameter (see above).
Employment status shows expected behaviour – slightly above average risks for ‘Self-Employed’, ‘Entrepreneur’ and ‘Retiree’ (low sample size for each of these).
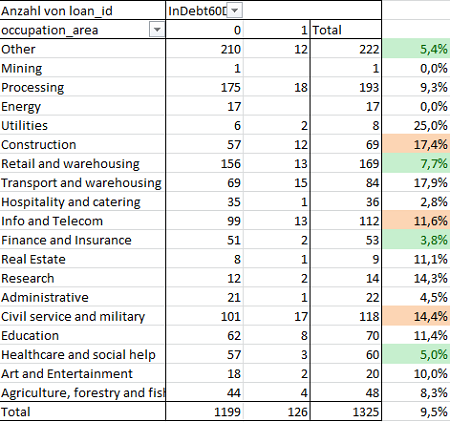
The analysis for occupation area shows big variations – see next table.

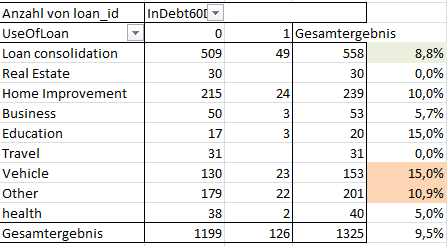
Regarding loan purpose (parameter ‘UseOfLoan’) it seems good advice to avoid loans related to vehicles. On the other hand the purpose loan consolidation which is very frequent on Isepankur, so far shows slightly than average.

Data also suggests that the risk is higher than average if the borrower has already more than one previous loan at Isepankur. However that might correlate with the age of the loan. Even for previous loan applications the same is true. Zero previous loan applications at Isepankur mean below average risk. One or more previous loan applications mean increased risk.
An absolutely to avoid category are those borrowers where the borrower ‘had rescheduled an earlier loan‘. The risk here is four-times higher than average!
There are a number of other factors I found, but I’ll omit them here since there is no way as investor to use them when filtering loan applications.An example is that applications signed at night (between 1am and 8am) show high risks (offtopic: I read that some ecommerce retailers restrict some payment methods for orders made after midnight to reduce fraud). Lower than average risk is applications signed between 5 and 7 pm (presumably those are borrowers that come home from work at that time). But since the application time is not visible in the loan listings it cannot be used for selection.
How to use this information?
If you do manual bids, you can make full use of the gained information. However most A1000 Estonian loans are filled 100% instantly by investment profiles (automatic bids). But none of the mentioned parameters are supported by investment profiles. That leaves two possible choices:
- Buying on the resale market. However that is very time-consuming as investors can only filter for gender, age and loan purpose. All other parameters would have to be checked for each individual loan meaning lots of required clicks.
- Bidding with investment profiles on all Estonian A1000 loans. Later review the successfully aquired loan parts and sell those that have above average risk (according to the above criteria) on the resale market. Again this will be time consuming.
If Isepankur would add more parameters to the advanced options in the investment profile setup, this could be a chance to make use of the information gained from the data export sets. But it does not look this way. In fact there will be a change tomorrow which mostly removes DTI selection possibilities from profiles as Isepankur says DTI is irrelavant as risk indicator (a claim backed by data; even though this seems counter-intuitive). Another mid-term possibility could be the arrival of third party tools. They are already used by Lending Club and Prosper investors. If Isepankur would offer an API it would probably only be a short while before the first automated bidding tool for Isepankur is online.
If you have interesting conclusions made from the data export – please share them by posting a comment. Thank you!

Hi!
Very Interesting finding. But as you mention, it’s difficult to use in order to select good loan profile.
I have invested 1700€ starting may 2013. I have mostly invested in A1000 estonian and currently have 190 loans.
My current return is according to isepankur 23.53%. But I made a different calculation using XIRR. I calculate that my current investment value in Current investment plus 90% of overdues plus 40% of 60+ overdue.
So my estimate of the return is 10.54%, whiche is very good and more realistic that return calculated by isepankur.
The 40% above is used avec Isepankur gave me the real recovered lending of 60+ overdue issued in 2010 and 2011.
What do you think of my estimate?